By Daniel Prince
Commercially prepared bacterial spores known as biological indicators (BI) are the preeminent tools used to verify and validate that items subjected to steam or dry heat sterilization are sterile to a very high level of probability. This is because they are used as standards to allow measurements of multiple replicates that are repeated which can be followed by critical statistical examination. In a validated sterilization process when, for example, one million (106) items from a homogenous population are loaded into a sterilizer not more than one item is expected to be non-sterile. This outcome is referred to a one in one million (10-6) probability of a non-sterile unit (PNSU) or alternatively as a sterilization assurance level (SAL). BIs are commercially available with known numbers of spores present (N0) and a known inherent resistance of that spore to heat. The temperature in which the resistance of the spore to the lethal process changes by a factor of ten is known as the DT value. The change in temperature that causes a tenfold change in the DT value is known as the zT value.
The maximum number of spores present on a BI is usually limited to 1 -2 million. The BI is placed in the sterilizer and subjected to the sterilization process. When using moist steam heat the sterilization reference temperature (T) is 121C. For dry heat it is usually greater than or equal to 200C. Once the sterilization cycle is completed the BI is cultured to determine the number of survivors, if any. When N0 is one million and there are 1,000 (103) survivors the spore reduction is 1,000. For moist steam heat 121C is referred to as the reference temperature. For example Geobacillus stearothermophilus has a DT value of 2 minutes at 121C (D121 = 2 minutes). After exposure to 2 minutes at 121C the number of surviving spores is expected to be N0/10. The theoretical time needed to destroy all one million spores subjected to sterilization at 121C is given by
D121 x Log N0 = 2 x 6 = 12 minutes.
When the number of survivors is transformed to log 10 a linear plot is obtained on semi-log paper against the sterilization temperature DT values are accepted as a measure of the microbial destruction rate as inputs for determining the z value. The graph of log D versus temperature is called the thermal resistance (TR) curve.
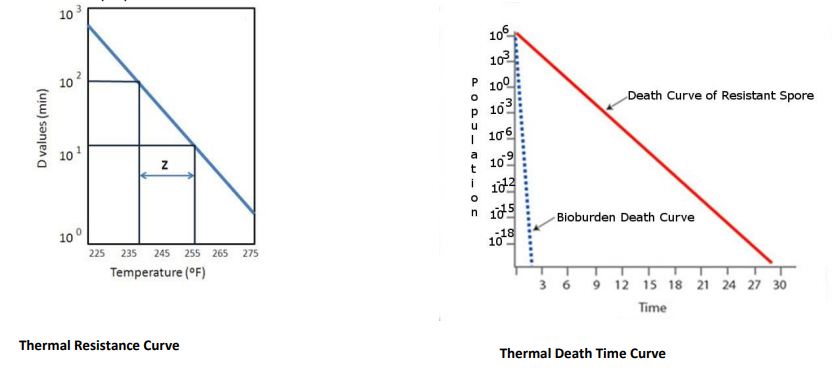
A thermal death-time (TDT) curve is a graph of Lethality (log F) versus temperature. The TR curve differs from the TDT curve in that a TR curve is, by definition, the time (D value) at a range of temperatures necessary to destroy 90% of the organisms in a homogeneous microbial population, whereas the TDT curve is the time (F value) at a range of temperatures necessary to produce some given or specified level of microbial destruction (FT = DT × SLR, where SLR is the spore-log reduction). For the same homogeneous microbial spore population and substrate, the TR and TDT curves are parallel.
Again with respect to a homogeneous commercially prepared BI manufactured under cGMP the D value of a given organism is influenced by other factors. When a given factor such as temperature causes a tenfold change on the D value this is known as a z value. Thus at 131C or 111C the D value of Geobacillus stearothermophilus is D121/10 = 0.2 minutes and D121 x 10 = 20 minutes, respectively.
In liquid preparations pH can combine with temperature to influence the D value. For example, for Geobacillus stearothermophilus placed in food at 115C at pH 2.7 D115 was reduced by a factor of ten. Thus, zpH115 = 2.7. At 135C a pH of 4.7 caused a tenfold reduction in the D value and thus, 135 = 4.7.